Every down candle must support price up, and every up candle must support price down.
Michael J. Huddleston (ICT)
Candlesticks’ Role In ICT Trading
The conventional use of candlesticks in trading, often referred to as “candles,” has traditionally focused on analyzing the shape of each candle along with its directional movement or color. Traders commonly recognized candlesticks as Red Hammers, green shooting stars, bullish engulfing, and the likes. They are commonly traded with lagging indicators such as moving averages, VWAP, RSI, and so forth.
However, when ICT introduced his concepts to the public, he offered a much simpler alternative perspective. Rather than fixating solely on candle shapes, ICT emphasized three key aspects:
- Directional Move: How the candle moves (bullish or bearish).
- Size: The range between the open and close.
- Relative Position: How the candle appears on the chart in relation to adjacent candles.
What’s more, ICT’s approach does not rely on any indicators and is traded purely based on price action. This approach became the cornerstone of many of ICT’s trading principles and is arguably one of the most powerful and fundamental concepts within his system. Before diving into ICT’s Building Blocks, it’s crucial to grasp how candles are interpreted in his methodology.
Once understood, these concepts, will not only be able to define and refine entries, targets, and stop losses but also gain insights into directional support and early signs of potential breakdowns.
Understanding ICT Candlestick Basics
A candlestick comprises four main components: open, high, low, and close (often abbreviated as OHLC or OLHC).
- Bullish (UP) Candle: When the closing price is higher than the opening price.
- Bearish (DOWN) Candle: When the closing price is lower than the opening price.
The conventional methods usually focus on each individual candle. It is worth noting that there are some traders who look at multiple candles as one. This method is usually dubbed candle math where the traders will take the open of the first candle, and the close of the last candle as the body of a combined candle. If the combination of two or more candles mimicked a single hammer candle, then they will treat that combination as a hammer candle.
Series Of Candlesticks As Higher Timeframe Candles
ICT’s first concept covered is to view consecutive candles of the same color or direction as a single higher timeframe candle. The difference between ICT’s approach and the candle math approach is that ICT do require the series of candles to be of the same color and direction.
The rationale behind his approach lies in the fact that buying and selling activities are not strictly confined to specific timeframes. Institutional buyers, for instance, do not limit their purchases to a single 5-minute window; they continue buying until their portfolio requirements are met regardless of the period of time needed to fulfill their large orders.
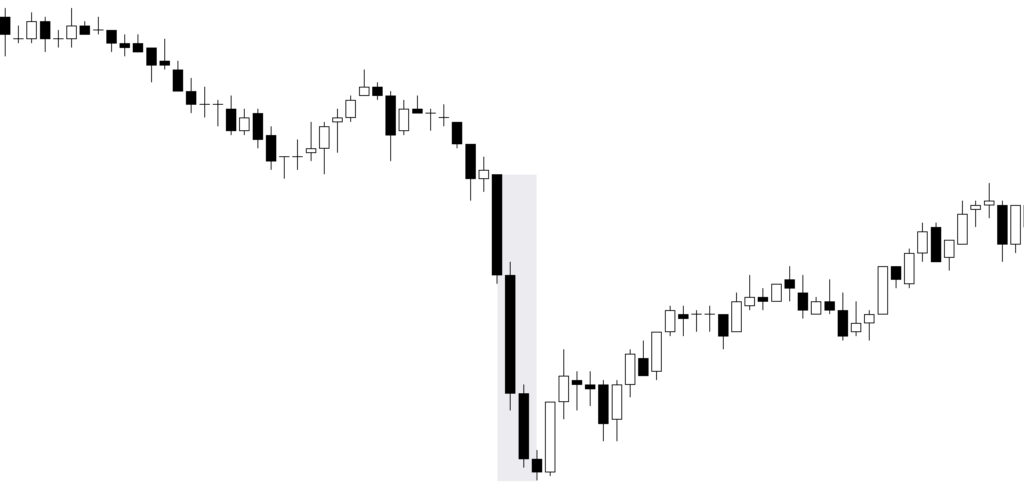
When analyzing a chart, a series of similar directional move candles are treated as a single higher timeframe candle, with the last candle in the series representing the current timeframe.
In the example above, the entire downward move can be treated as one 20-minute down candle, while the last down candle corresponds to a 5-minute timeframe. By approaching price action in this manner, traders have two options:
- Weighted Approach: Give more significance to the 20-minute move. This approach considers the broader context of the price action and can reduce the risk of taking a trade before a higher timeframe narrative had developed.
- Higher Risk-Higher Reward Approach: Use the 5-minute candle as a decision point for an early entry. It provides a higher risk-reward opportunity since it is contained within the 20-minute selling cycle and can be used in anticipation for a higher timeframe change in direction.
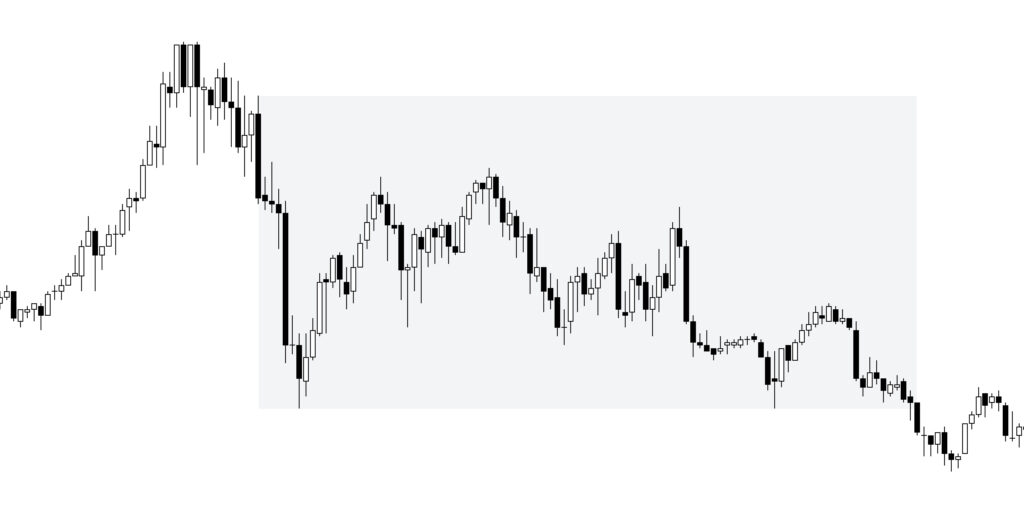
Price Action Contained Within Larger Moves
Another crucial concept is that price action can be contained within a larger move. For instance:
- A strong upward move (represented by one or more up candles) may be followed by consolidation or a series of smaller up-and-down movements within its range (its high and low).
In such cases:
- The larger move becomes the main reference point for higher probability decisions.
- The smaller internal moves serve as temporary pauses or adjustments to satisfy higher timeframe conditions.
- Traders can choose to trade these internal moves within the context of the larger move, or in anticipation of larger move reversal especially if there is strong conviction and bias. They can also wait for the larger move to develop.
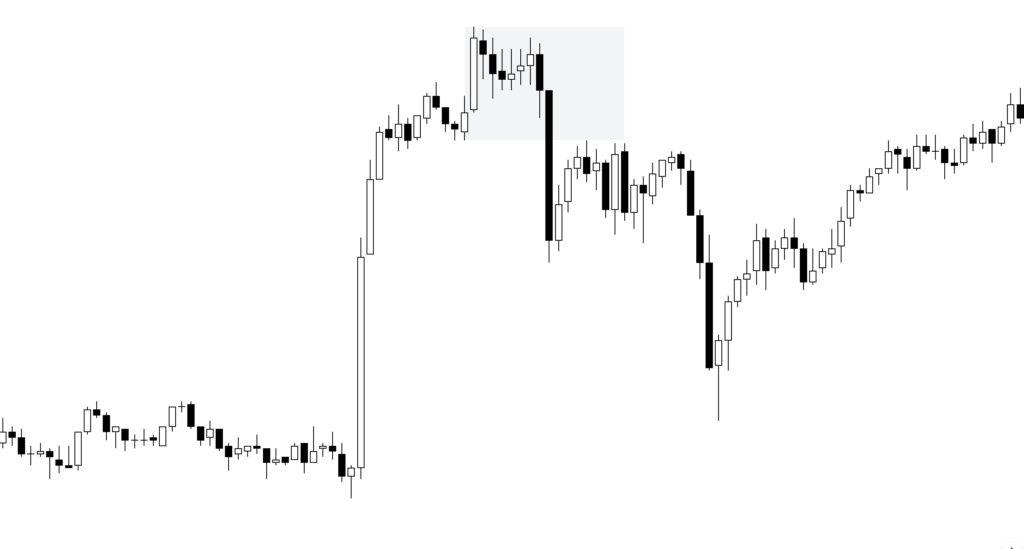
For example, consider a strong 1-hour (1H) upward move followed by a smaller candle creating what’s known as a Fair Value Gap (FVG). If the higher timeframe bias is bullish, the expectation is that the next 1-hour candle will retest the FVG before continuing higher. On a 5-minute chart, this may appear as an upward move followed by a breakdown lower, only to reverse and resume the upward trend trapping and stopping out the traders.
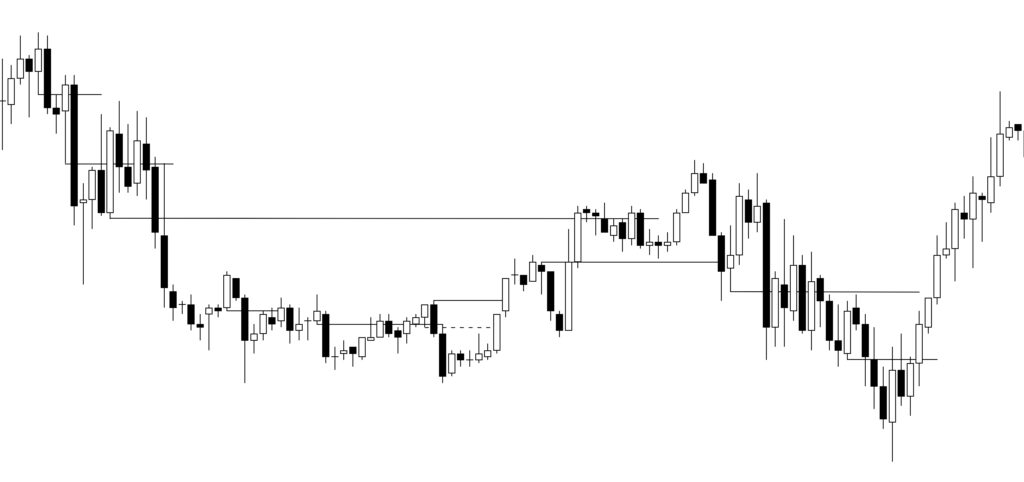
How Candlesticks Control Flow
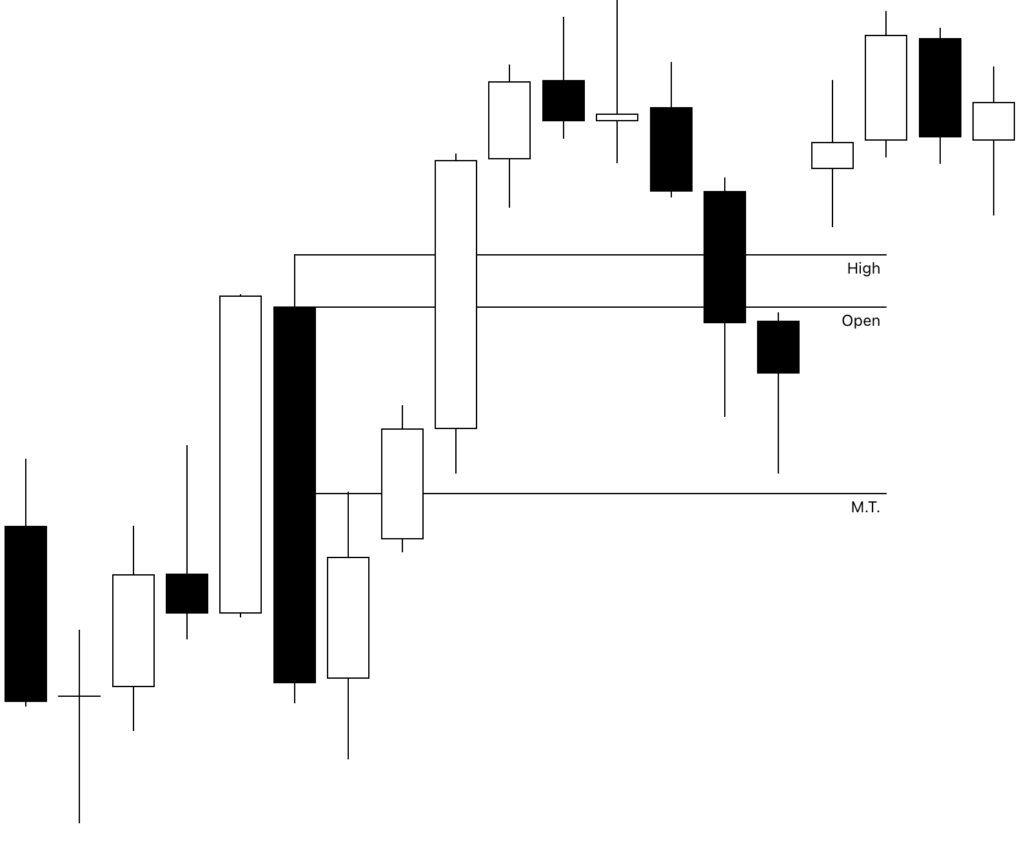
ICT stated that in a trending market, every bullish (up) candle acts as resistance pushing price down, and every bearish (down) candle acts as support pushing price up. When price does not respect these two rules, then the price is either in consolidation or preparing for a potential reversal.
If bearish one or more candles can act as support, and bullish one or more candles can act as resistance, then important levels need to be respected to validate it.
There are three levels to pay attention to:
- High or Low
- If the price moved higher then retraced into a bearish (down) candle, its high serves as the first support level.
- If the price moved lower then retraced into a bullish (up) candle, its low acts as the first resistance level.
- Open Price:
- The open price of the bullish or bearish candle acts as the second support and resistance level respectively.
- Median Threshold (M.T.):
- The M.T. represents the halfway point between the open and close of the candle, not the high and low, it acts as the third and final support or resistance level respectively.
With this knowledge, traders can recognize minor retracement and anticipate where support or resistance could be found either to take a new trade, validate the health of a trade, or trail a stop loss on an existing trade.
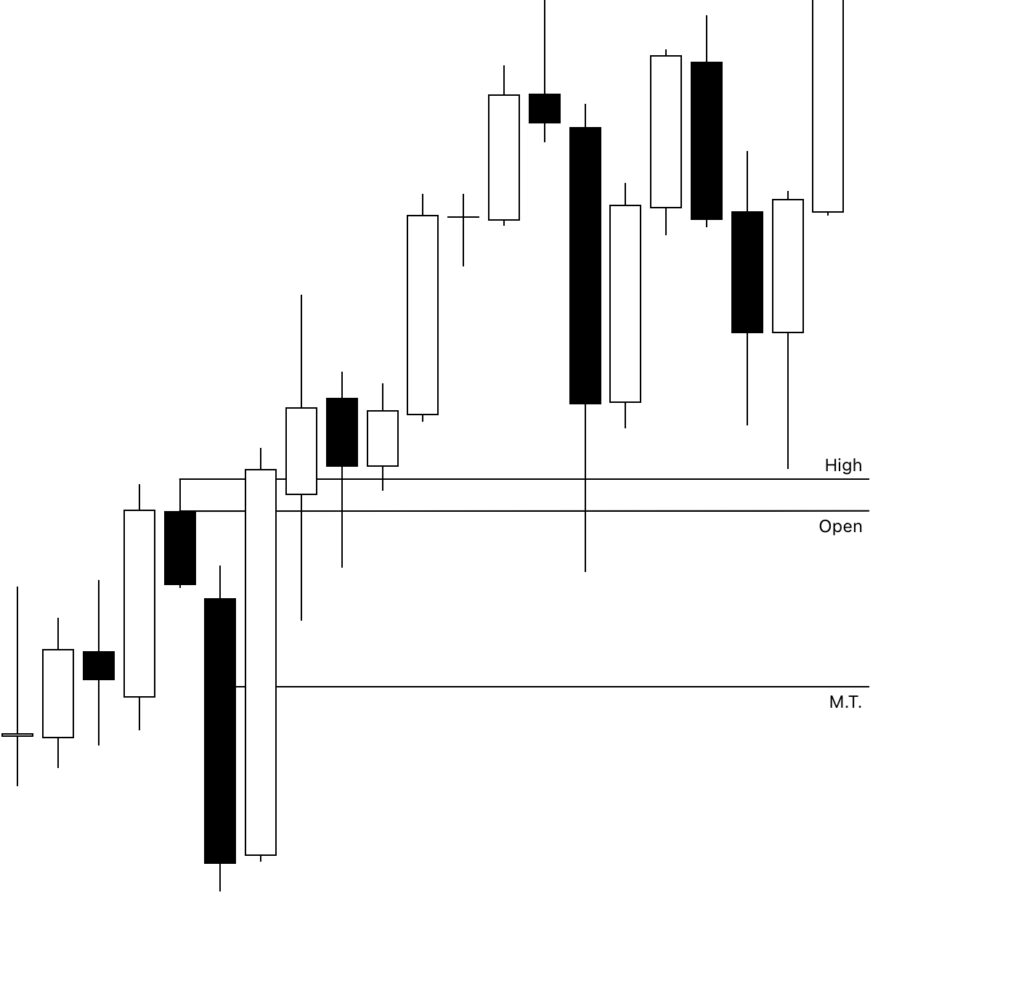
It is important to keep in mind that these are support and resistance zones. Price can retrace deep into these zones as long as it closes, at most, near the middle point and not deeper than that. For example, the price may drop deep into the support candles then recovers creating a wick lower than the middle point.
In the case of multiple support candles, if the price does close below the middle point, a trader could update the trade and base it on the last candle only rather than the entire series. The logic behind that is that while the higher timeframe levels did not hold, price might be reaching to the current timeframe levels.
Improving The Odds of The Trade
When looking at a chart, any trader would notice that there are multiple instances where the price did not respect the first up or down candles giving the impression that a reversal is about to happen then finds the support it needs at the prior area.
To better identify the higher probability levels, additional rules can enhance the odds in traders’ favor.
Price Must Move Away From Current Supporting Candle
The first supporting rule is to require a clear move away from the bearish or bullish candle for it to act as support or resistance. Different traders may use different requirements, there is no set calculation however, the following seem to enhance the levels:
distance can be based on the candle’s body size, for example price must move twice the body of the candle for it to act as support, or at least one other candle must open and close above it.
- Price must move away twice the distance of the body of the support or resistance candle. ICT uses this approach.
- A subsequent one or more candles must both open and close above the high or low of the support and resistance level respectively
Create A Pivot Point
The second supporting rule is the formation of a Short Term Pivot Point (Short Term Low and Short Term High) by the supporting candle or the wick of the candle after it. The presence of a pivot point is considered strong support and a break below the pivot point, or break above a pivot point, could be an early indication of change in direction.
Final Notes
When looking at the chart below, it could potentially be viewed as random price action that difficult to predict.
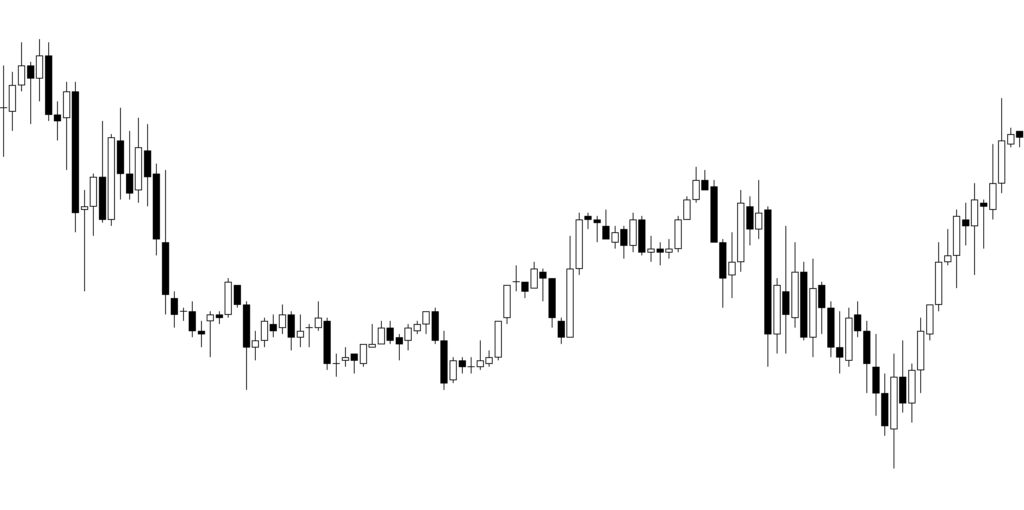
When ICT Candlestick concepts with the supporting rules are applied, the price action starts to make sense.