“The wicks do the damage, but the body tells the story” – ICT
Wicks In ICT Methodology
When applying ICT’s Candlestick Fundamentals, traders often focus on the body of the candles—the area between the open and close—since it encapsulates the bulk of the volume and transaction activity.
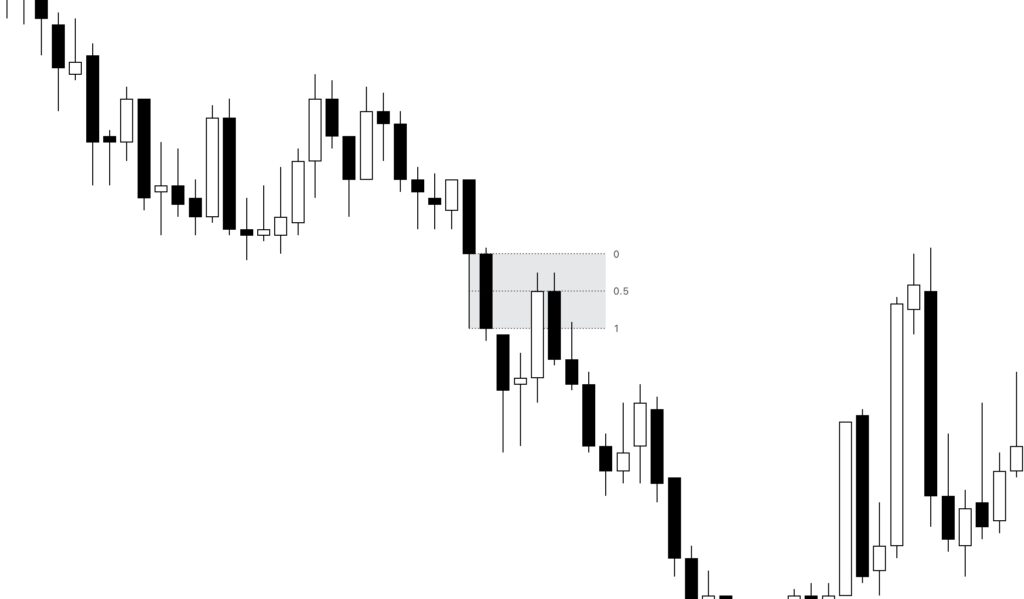
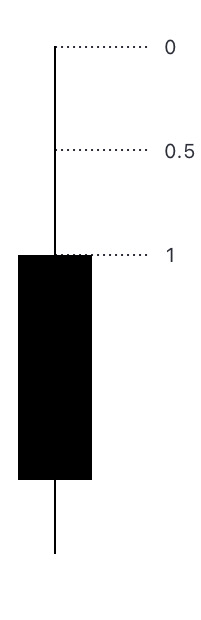
However, the wicks (also known as shadows) play a significant role in ICT’s methodology. Long wicks are treated as volume inefficiencies, akin to Fair Value Gaps (FVG). The underlying expectation is that price may seek to revisit the Consequent Encroachment (C.E.), which corresponds to the middle point of the wick. As traders, we must pay special attention to these wicks and remain open to the possibility of unexpected reversals.
To identify the C.E. point, traders can draw a Fibonacci retracement from the bottom to the top of the wick and identify the 50% mark.
Using The Wicks To Identify Points Of Interest
When analyzing a trade, one of the goals of the analysis to find potential reversal points. Long wicks C.E. Can be one of these areas. This does not mean price will reach that exact point and reverses, but rather think of it as a potential target and watch the reaction. Partials can be taken, a trade can be exited, or if looking for a good reversal setup, it can be considered an area where price may reverse and look for one like any other PD array.
When analyzing a trade, one of the primary goals is to identify potential reversal points to enter or set as a target. Long wicks and their Consequent Encroachment (C.E.) can serve as such areas. However, it’s essential to understand that this doesn’t guarantee that price will precisely reach that point and reverse. Instead, think of it as a potential target zone and closely observe how price reacts.
Traders could:
- Partial Profits: Take partial profits as price approaches these areas.
- Exiting Trades: If a trade is already open, consider exiting or adjusting positions near these levels.
- Reversal Setups: For those actively seeking reversal opportunities, view these zones as areas where price may reverse, similar to any other pivot or price distribution (PD) array.
Price Action Strength
The C.E. of a wick serves as a valuable tool for assessing the strength of price action. Traders can leverage this information in several ways. Assuming a trader is evaluating a higher timeframe to find setups on a lower timeframe:
- Trade Entry:
- When considering potential trade entries, observing how price interacts with the C.E. can provide insights.
- If price approaches the C.E. and shows signs of reversal or continuation, it may signal an opportune entry point.
- Setting Stop Loss:
- Traders can use the C.E. as a reference level for setting stop-loss orders.
- If price breaches the C.E., it could indicate a shift in momentum, prompting an exit from the trade.
- Trade Management:
- While waiting for a target to be reached, monitoring the C.E. helps traders assess ongoing price strength.
- If price stalls near the C.E., it may be prudent to manage the trade—either locking in profits or adjusting stop levels.
However, not all wicks are equally relevant:
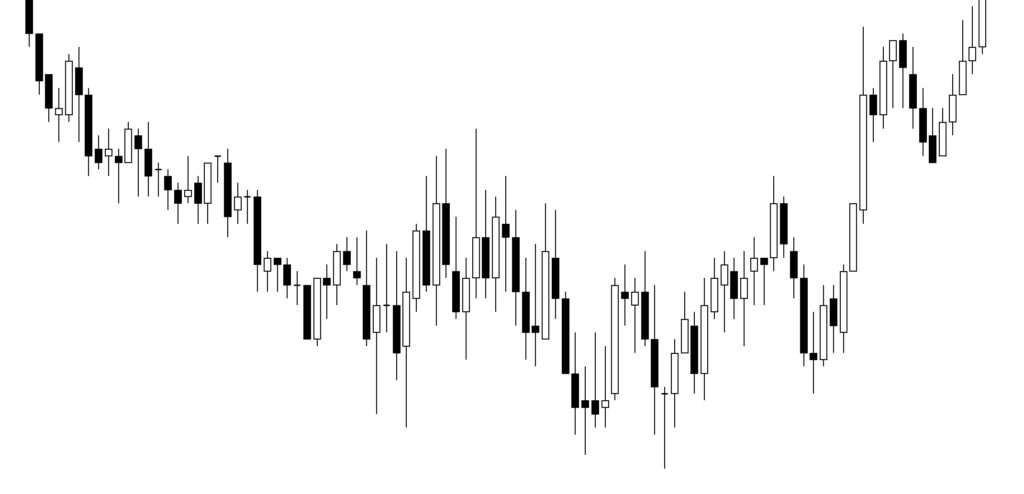
- Choppy Markets:
- As price moves, it leaves behind numerous candles with wicks of varying sizes, especially in choppy or indecisive markets.
- In such situations, multiple overlapping candles with upper and lower wicks indicate choppy price action.
- Traders should exercise caution during these setups and wait for clearer price movement.
Understanding the C.E. and wick dynamics allows traders to make informed decisions, adapt to market conditions, and enhance their overall trading strategy.
Using The Wick In A Stop Loss decision
When a buy setup presents itself, and a long wick is part of the pivot low where a stop loss would be placed, traders can use the wick’s Consequent Encroachment (C.E.) to refine the stop loss and gauge the setup’s strength.
Here’s how it works:
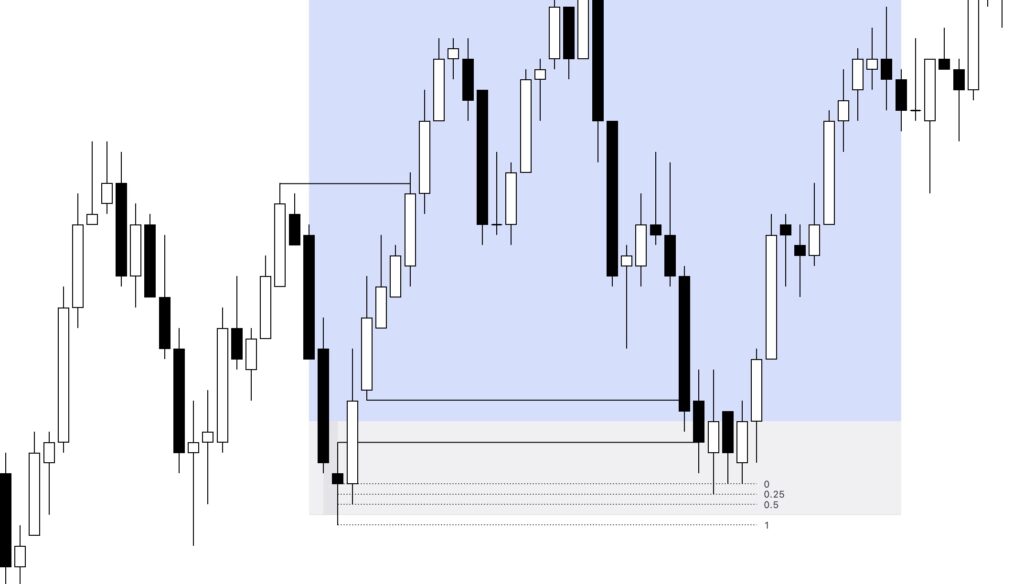
- Retracement Expectation: As price retraces back into the buy setup, the expectation is that it should not retrace more than 50% of the long wick.
- Indicator of Weakness: If price retraces more than 50%, it often signals weakness. In such cases, price could continue downward and drop below the wick’s low before reaching its target.
- Stop Loss Placement: While it’s acceptable (though not required) to place the stop loss just below the C.E. of the wick, what matters most is for the price to close around the C.E., even if the wick extends beyond it.
If the price reaches only 25% of the candle and reverses, it strongly suggests that price has reached a reversal point. However, this doesn’t guarantee reaching the ultimate target; it simply indicates that at this level, price wants to balance higher.
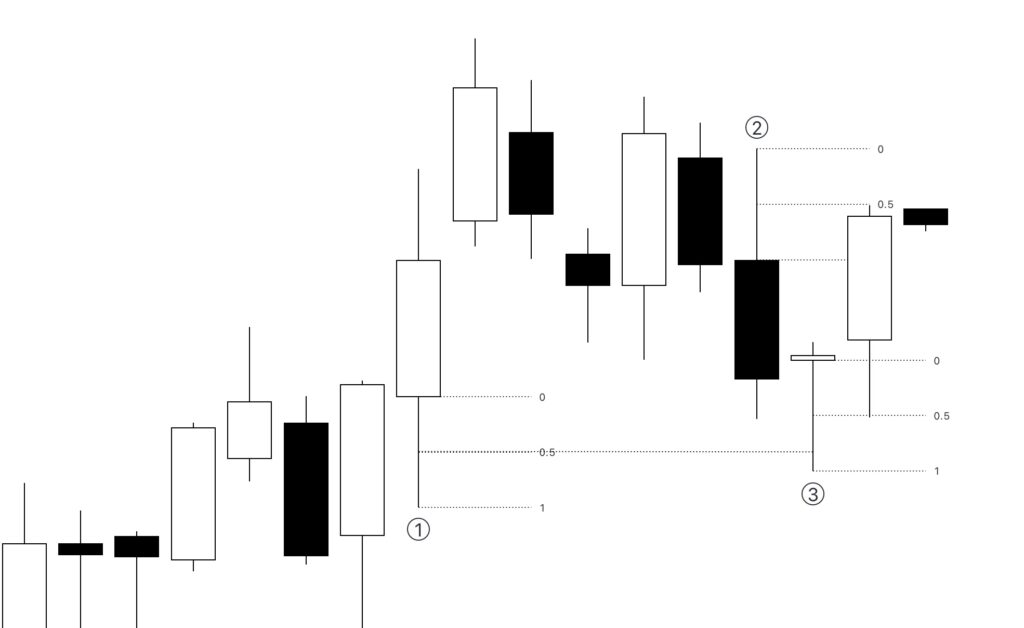
Using The Wick As Part Of FVG Entry
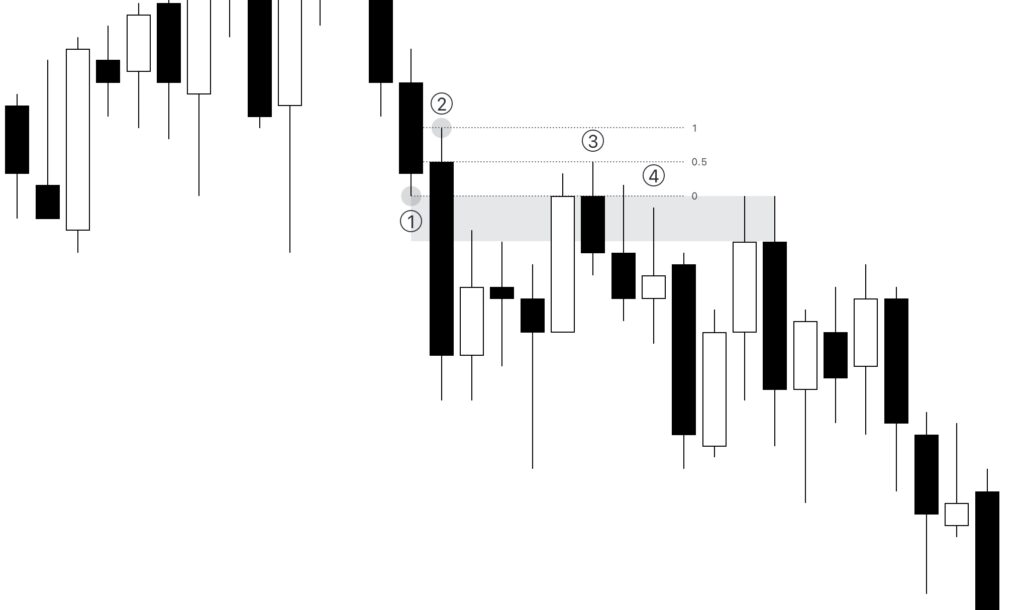
When analyzing retracements into a Fair Value Gap (FVG), traders can draw a Fibonacci retracement from candle #2’s high to candle #1’s low, which formed the FVG. The expectation is that price should not exceed the 50% Fibonacci level, creating what’s known as the Balanced Price Range, which means that the price range measured between the low of candle #1 and candle #2 is considered “efficient” or “balanced”, as it encompasses both buy and sell options due to the price movement going down and then up. Once this occurs, price should avoid revisiting this level within the current leg of the price action. Although rare, if price does reach the high of candle #2 , an assessment of the trade is necessary, and traders may need to consider exiting the trade.
Wicks Balancing Price Range
A balanced price range occurs when price provides both buy and sell opportunities. This balance can manifest as one candle moving down, followed by another moving up, or even within the wick of a single candle.
When a balanced price range is presented, the expectation is that the body of the price will not exceed the halfway point, referred to as the Mean Threshold (M.T.) or thereabouts. If it does, it may indicate weakness, but it does not necessarily require an immediate exit if you’re already in a trade.