The Market Reaches For A Level For A Particular Reason
Michael J Huddleston (ICT)
The ICT Candlestick Fundamentals section delved into ICT’s Candlestick Foundation, emphasizing how bearish (down) candles supports price increases, while bullish (up) candles supports price declines. This section, explores the identification of high-probability Order Blocks.
When large institutions decide to purchase financial instruments like commodities or Forex pairs, their actions have a significant impact. These institutions handle substantial capital and execute large orders. On the other side, sellers offer assets at a specific price (the “ask” price) and also set a stop loss just below recent pivot point lows.
How Large Institutions Buy Financial Instruments: Ask Price vs. Stop Loss
Institutional buyers have two approaches:
- Ask Price Purchase: They can buy assets directly from sellers at the ask price. This approach ensures immediate execution but may not always be the best deal.
- Stop Loss Purchase: Alternatively, institutions can wait for the sellers’ stop loss to trigger. When the stop loss is hit, the asset is often available at a discounted price compared to the initial ask price.
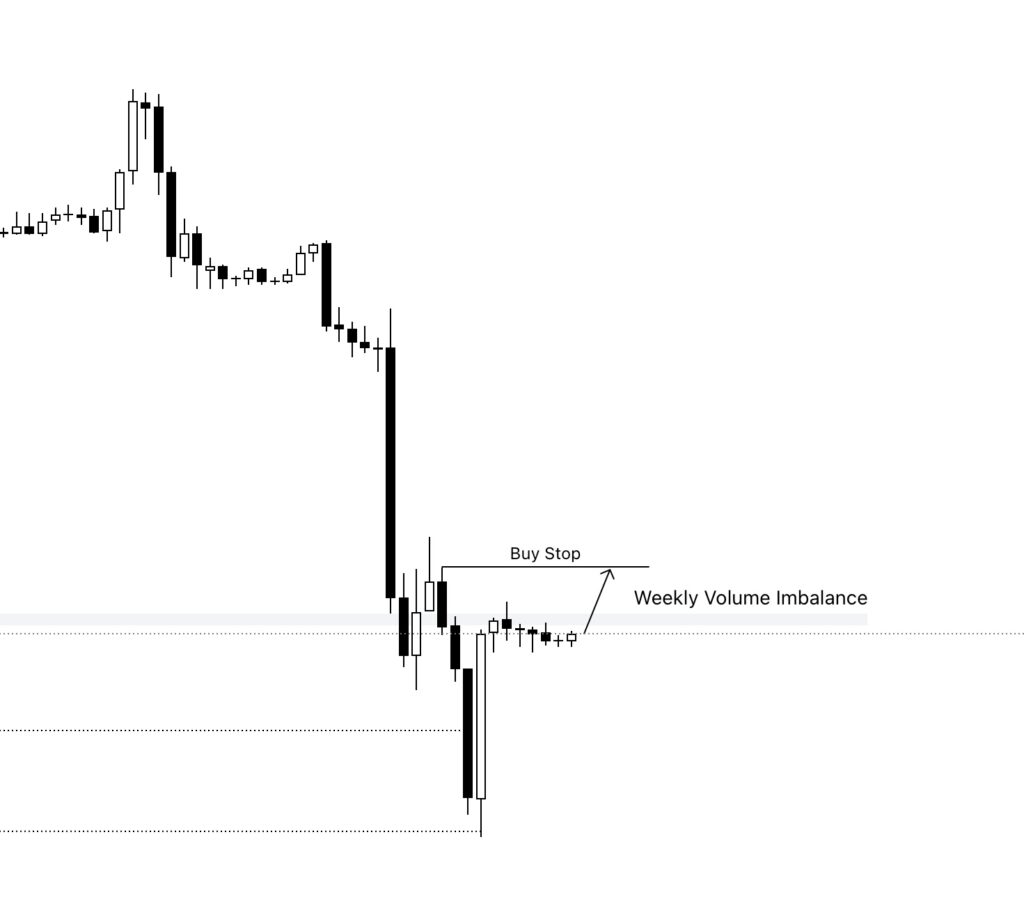
Additionally, sellers’ stop loss orders tend to cluster around recent pivot point lows. Multiple sellers placing stop orders at similar levels create a large pool of liquidity below the current market price. When institutional buyers step in after the stop loss triggers, their demand drives prices upward.
The same takes place if these large institutions decide to sell or short an asset but in the opposite direction. They will wait for the buy stops to trigger to sell performing the same mechanics explained above except in reverse.
Institutional buyers and sellers strategically balance immediate execution with waiting for better opportunities near stop loss levels.
Understanding this dynamic helps traders, both buyers and sellers, navigate the markets effectively by anticipating these transactions that ICT calls Order Blocks. Traders will need to identify signs of institutional buyers and sellers stepping into the market to join the trade.
what Are Order Blocks
Order Blocks appear on the chart in the form of bearish (down) candles followed by a strong upward move or bullish (up) candles followed by a strong downward move similar to what is explained in ICT Candlestick Fundamentals.
Not every bearish (down) candle or bullish (up) candle qualifies as a tradable order block. Traders will need to identify the high-probability order blocks in the direction of the bias and base their trades around it.
For an order block to be a high probability order block, it needs to have certain characteristics:
Key Levels For Strong Buyers and Sellers
High Probability Order Blocks often signaling either a continuation or a reversal when price has reached a key area where institutional buyers and sellers most likely to execute their orders. Traders need to keep in mind that price is fractal and the same concept and approach will work at any timeframe.
Some of the essential levels to watch:
- Timeframe-Based Levels:
- Monthly, weekly, and daily high and low points.
- Relative higher timeframes: Consider levels from higher timeframes highs and lows.
- Session-specific levels: Such as those during the Asia, London, and New York trading sessions highs and lows.
- Midnight open, 8:30 news embargo lift, and 9:30 market open.
- ICT PD Arrays:
- Higher timeframe Order Block levels
- Higher timeframe Fair Value Gap and Volume Imbalance levels
- Higher timeframe Rejection Blocks
- Current timeframe PD arrays
Some traders choose to mark their charts (or copies of their charts) with these levels and patiently wait for order block formations as price reacts to these critical points. Others prefer to observe an order block forming first and then investigate whether there was a viable reason for that reaction by analyzing the higher timeframes.
Some traders may also choose to pay attention to all the levels above, while others may choose to only take intraday trade reactions based on higher timeframes levels such as 1-hour and 4-hour FVGs and Order Blocks.
For example, a trader may decide to mark the 1-hour and 4-hour order blocks and wait for the price to get to these levels. Once it does, drops to 1-minute to 5-minute timeframe and wait for a high probability setup to take a trade.
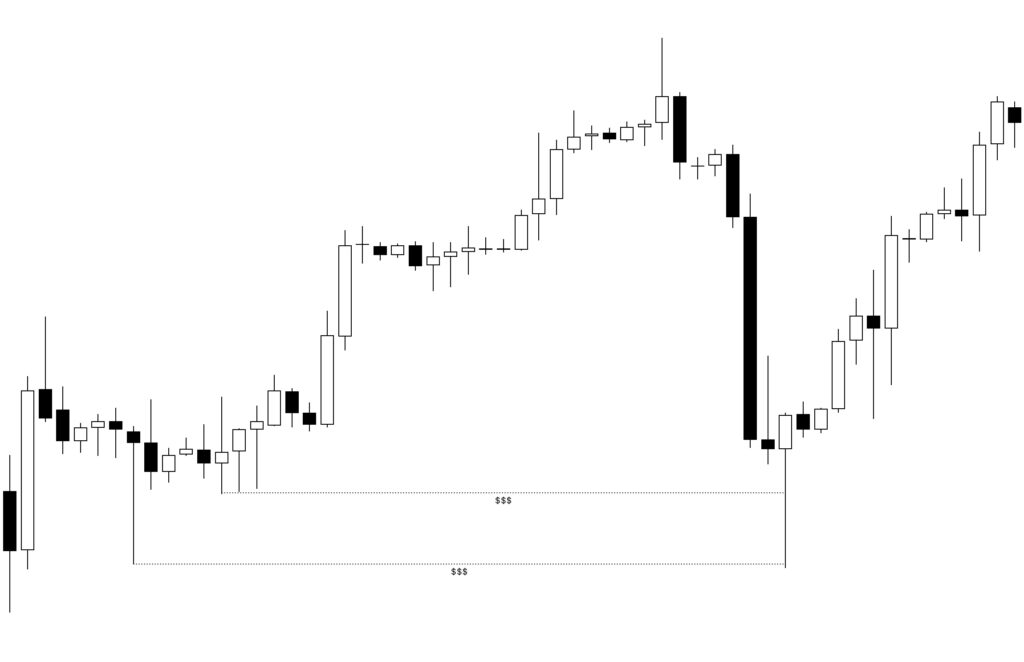
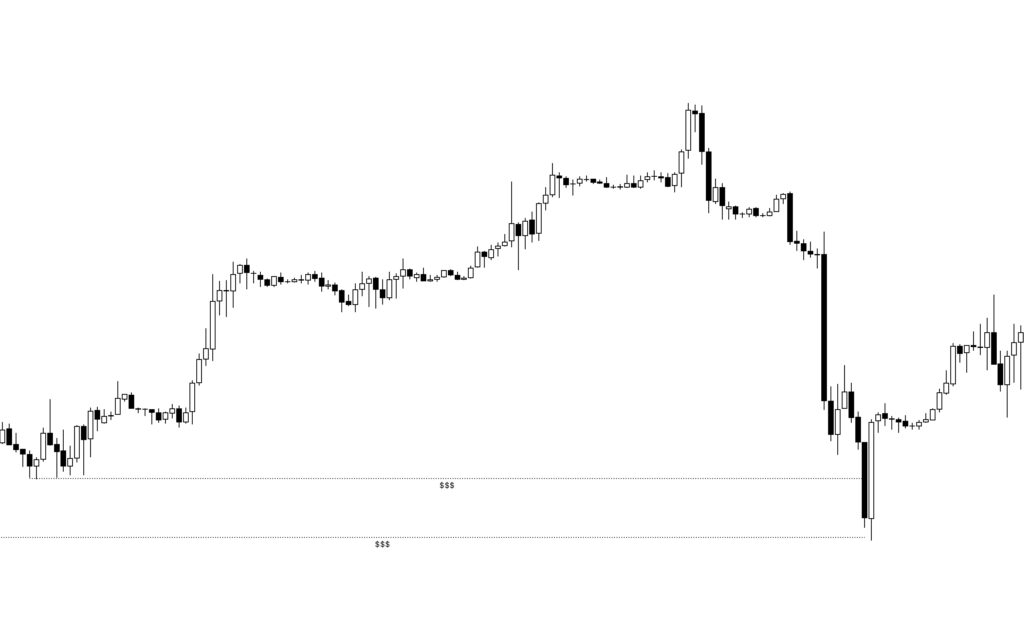
Understanding Liquidity Criteria
When price sweeps liquidity, the common expectation is that the triggered stop losses will increase the supply, potentially overwhelming the demand and causing prices to continue to move lower (in the case of sell stops) or higher (for buy stops).
However, if the price reverses and moves strongly in the opposite direction, it signals that strong buyers (or sellers in the case of buy stops) have stepped in. They are effectively buying up the additional supply, leading to a potential shift in market sentiment.
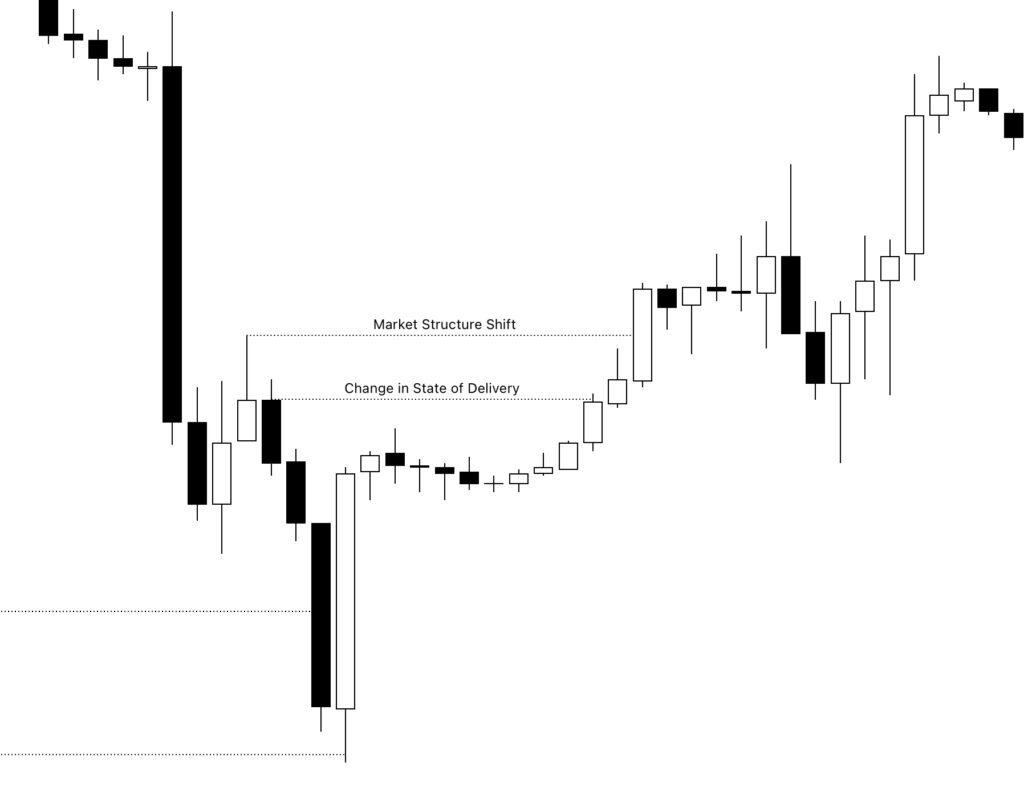
Market Structure Shift Criteria
For order flow to change direction, it often requires a shift in the behavior of previous supporting candles. These supporting candles play a crucial role in maintaining the price move in a particular direction. When they fail to uphold the price, it signals a Change in State of Delivery. That Change in State of Delivery takes place when price trades back through the supporting candle’s open.
Additionally, if an order flow reversal causes a previous high (in a bearish order flow) or a previous low (in a bullish order flow) to be traded above or below, it serves as a strong indication of a change in order flow by cause a Market Structure Shift. These levels act as significant turning points where buyers or sellers take control.
Strong Displacement Criteria
For order flow to convincingly change direction, price must exhibit signs of strong buying (in a bullish scenario) or selling pressure (in a bearish context). Here’s how it works:
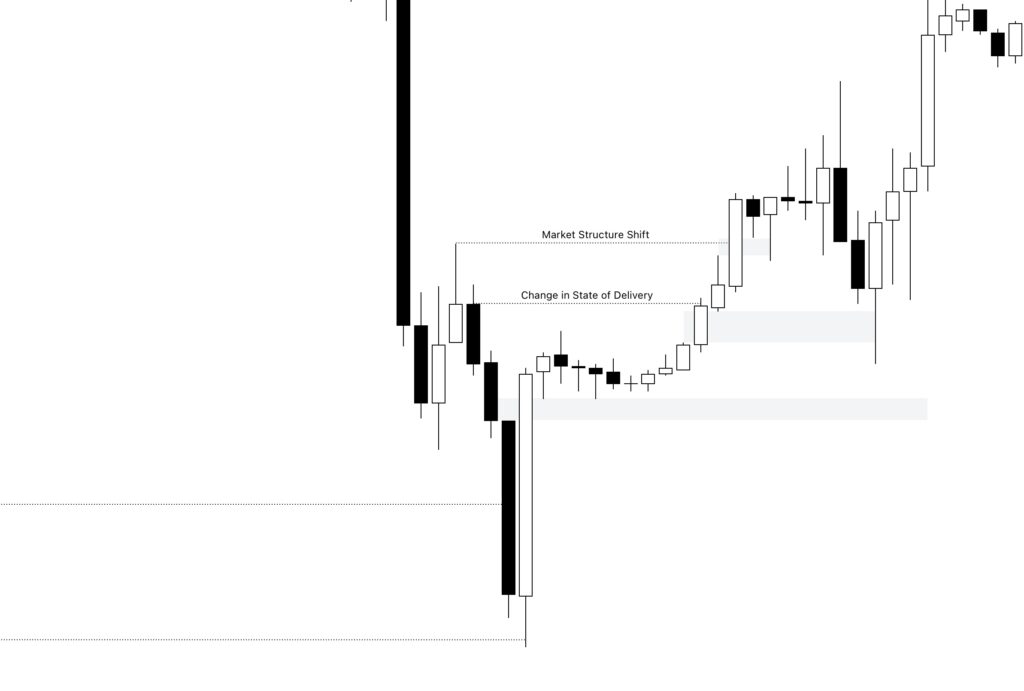
Large candles either a single substantial candle or a sequence of them indicate significant market activity. After the strong price move, the formation of a Fair Value Gap (FVG) represents a gap between the previous fair value and the new price. It suggests that other institutions have agreed that it is worth buying at that price without waiting for a pullback for the time being.
Putting it All Together
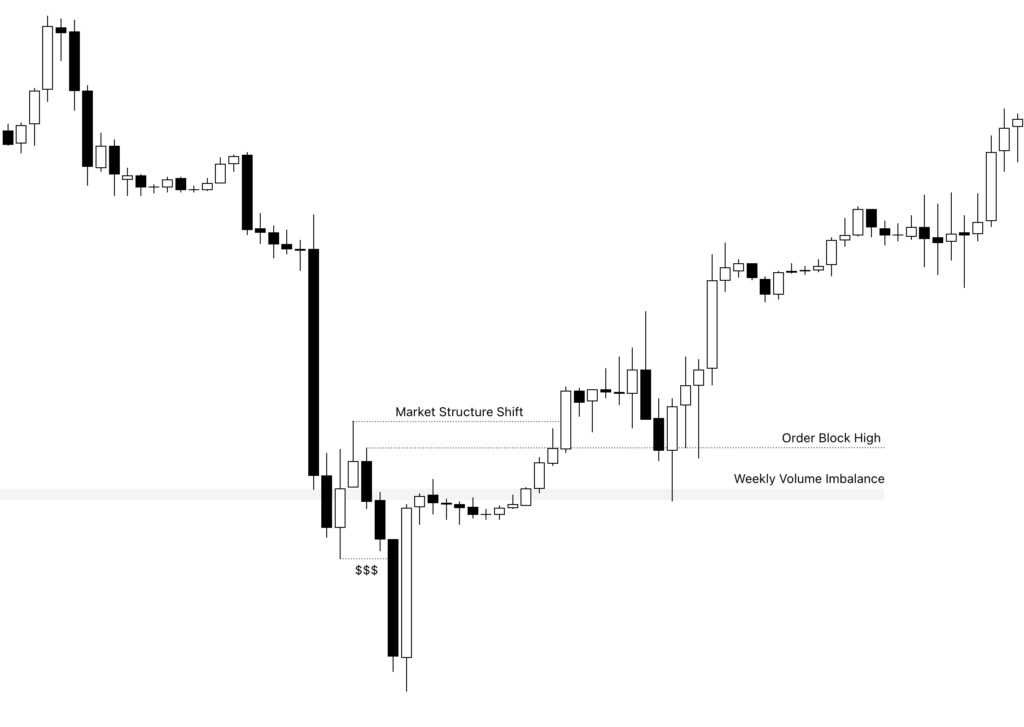
Using a bearish order flow as an example, when the price is trending downward, every upward candle is expected to support moving the price down. As the price reaches an institutional level where buyers may step in, traders look for signs of a change in direction.
- Has the order flow reached an institutional level?
- Did the price sweep liquidity?
- Did the price result in a Change of State of Delivery?
- Did the price cause a Market Structure Shift?
- While it is not always required, did a displacement result in Fair Value Gap formation?
If the answer is yes, it indicates that a high-probability order block has formed, and a trade setup can be formulated based on it.
Taking a Trade
There are multiple possible setups when it comes to order block formations.
Aggressive Entry
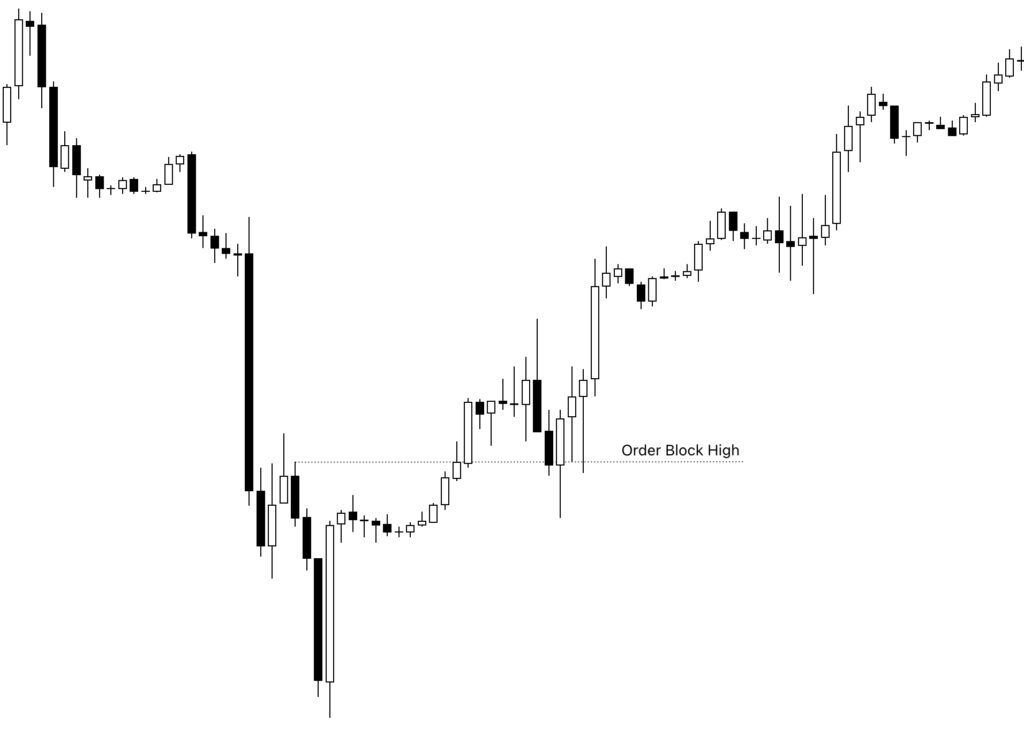
A bullish Order Block is formed when the price moves above the high (or the highest high in the case of a series of bearish candles), while a bearish Order Block is formed when the price moves below the low (or the lowest low in the case of a series of bullish candles).
For a bullish Order Block, a trader can take an aggressive entry by placing a buy stop order at the high of the bearish candles in anticipation of the Order Block formation. When the price reaches that level, the buy order will be filled.
This approach is considered aggressive because not all of the probability order block criteria have been met and price could continue lower.
Less Aggressive Entry
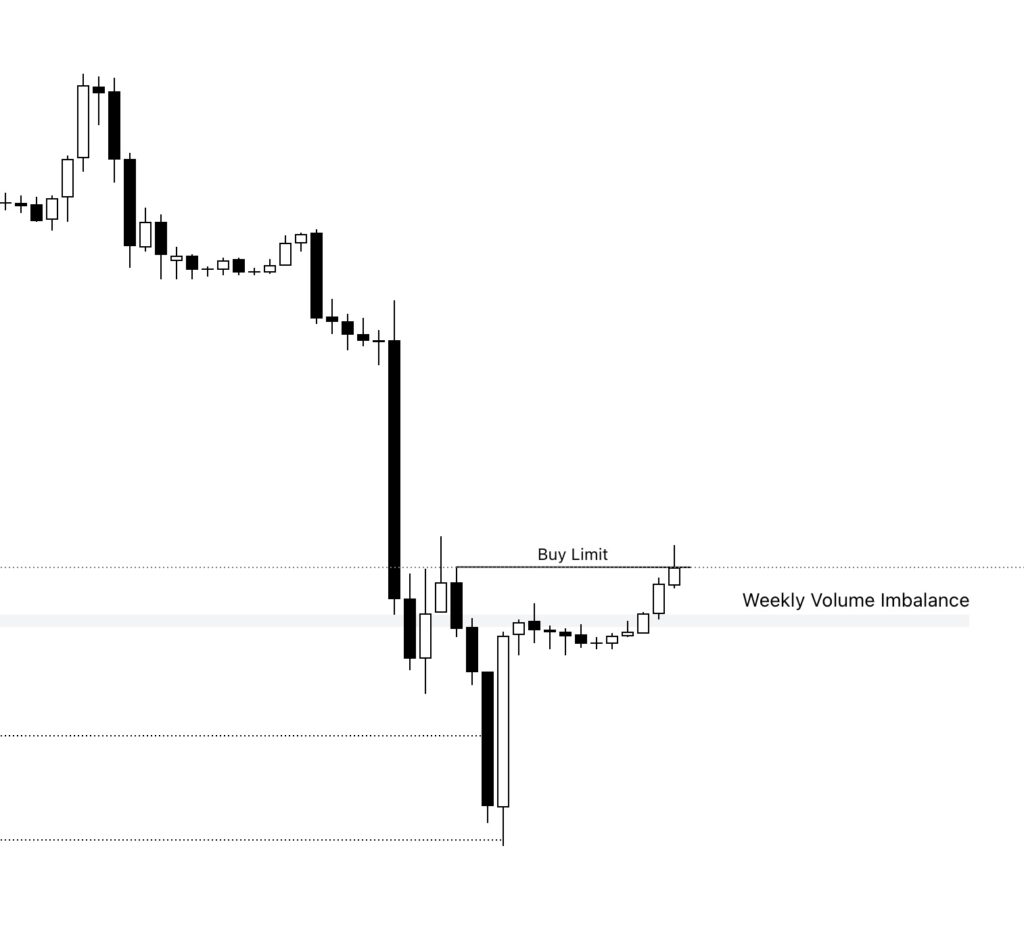
a less Aggressive approach is to wait for the price to break above the high of the bearish candles then place a buy limitorder at the high of the bearish candles with the expectation that price will usually drop back and tap the high before continuing higher.
This approach is still a risky approach since price has not completed the high probability criteria.
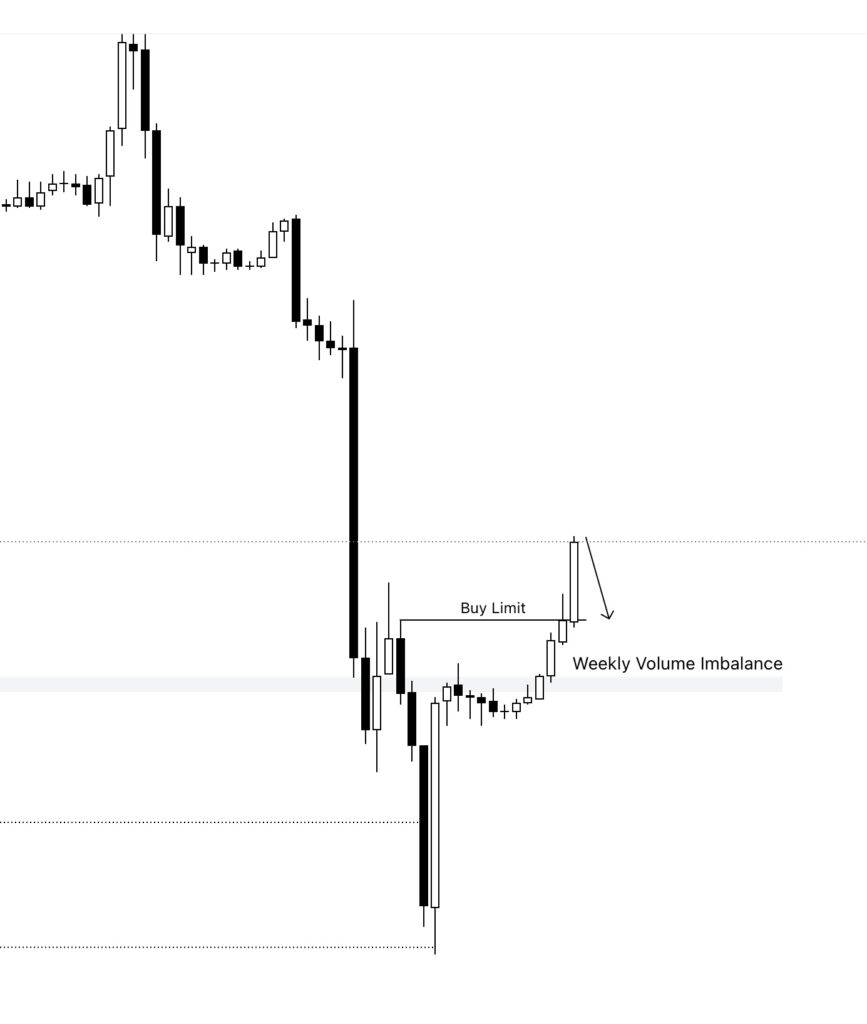
High Probability First Possible Entry
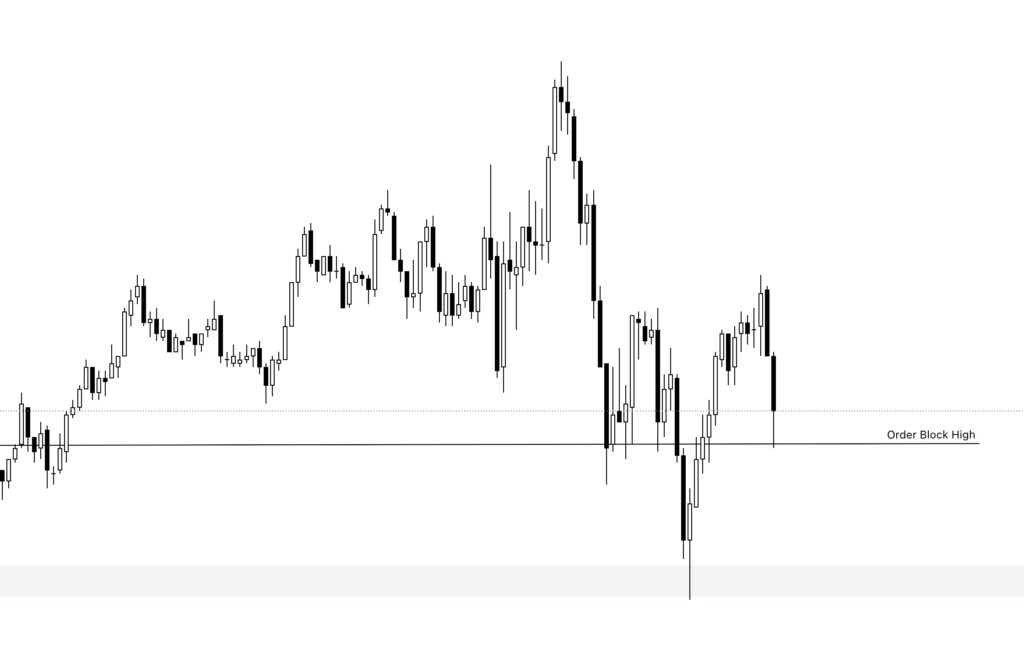
The third entry type is the most commonly used by ICT traders. It is executed by placing a buy limit order at key Order Block levels explained in the ICT Candlestick Fundamentals or a Fair Value Gap (FVG) near the order block after all the high-probability criteria have been met.
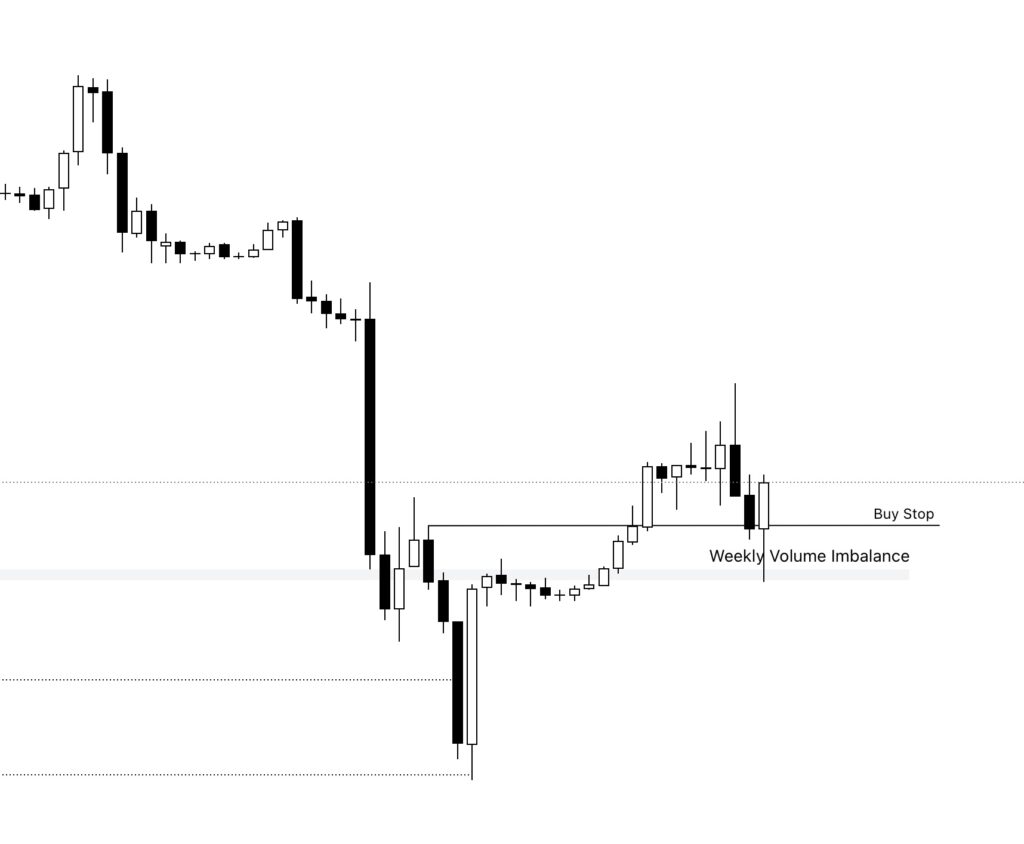
High Probability Second Possible Entry
The third possible entry type is to wait for the price to drop below the expected entry level, such as the Order Block High, before placing a buy stop at the top of the Order Block High. This approach risks missing the entry by having the price wick into the level and then continue higher. However, it also protects the trader in case the price continues its bearish move.
Lower Timeframe Entry
A higher reward approach would be to wait for a high-probability Order Block to form. Once it does, watch for the price as it returns to the Order Block levels. Then, drop to a lower timeframe and watch for similar behavior. If a lower timeframe order block forms, same setups described above can be used for entry on the lower timeframe. This method allows for a more precise entry while maintaining alignment with the overall market structure.o